Stop Checking 5 Dashboards Every Morning
You wake up, grab coffee, and start the ritual: Vercel, then UptimeRobot, then GitHub, then PageSpeed, then... There's a better way.

James Wolf
Founder @ SlyDuck
The Morning Ritual
Every morning, thousands of developers do the same thing:
- Vercel/Netlify - Check if deploys are working
- UptimeRobot/Pingdom - Check if sites are up
- GitHub - Check for security alerts
- PageSpeed Insights - Spot check performance
- Google Search Console - Glance at SEO
By the time you're done, it's been 20 minutes and you haven't written any code.
Why We Do This
Because peace of mind requires information. And the information is scattered across five different tools, each with their own:
- Login
- Interface
- Notification settings
- Free tier limitations
We're not monitoring. We're doing reconnaissance.
The Hidden Costs
Context Switching
Every dashboard is a different mental model. Vercel thinks about deploys. UptimeRobot thinks about pings. PageSpeed thinks about performance scores. Your brain has to shift gears five times.
Alert Fatigue
Five tools means five places to configure alerts. Miss one setting and you either get spammed or miss critical issues.
Incomplete Picture
Site is up (UptimeRobot says so) but slow (PageSpeed knows, but you haven't checked). Dependencies are vulnerable (GitHub sent an email last week that you archived).
No single tool connects the dots.
What "Consolidated" Actually Means
It's not just about having one login. It's about connected intelligence:
Example scenario: Your site starts responding slowly.
Five dashboards approach:
- UptimeRobot: "Site is up" (technically true)
- Vercel: "Deploy succeeded" (not the problem)
- PageSpeed: You haven't checked today
- You find out when a customer complains
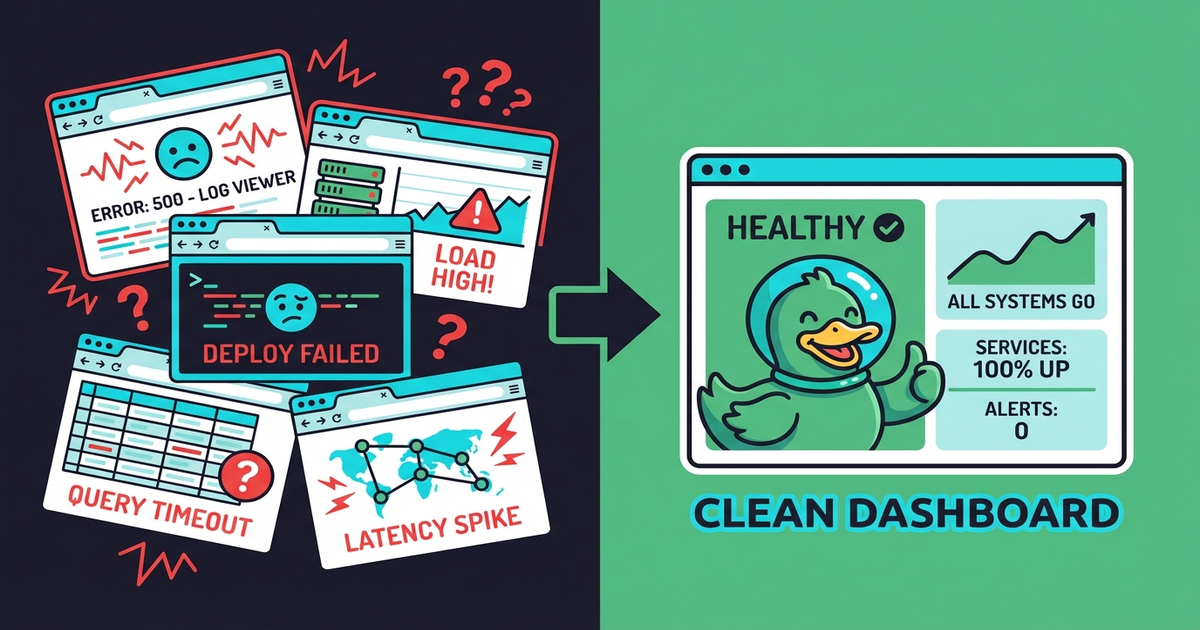
Consolidated approach:
- Health score drops from 92 to 71
- You see uptime is green but performance flagged
- Core Web Vitals show LCP spiked
- You investigate immediately
What Belongs in One Dashboard
For indie developers and small teams, you need visibility into:
- Is it up? - Uptime monitoring
- Is it secure? - Dependency vulnerabilities, SSL status
- Is it fast? - Performance metrics
- Is it findable? - SEO basics
- Is it backed up? - Backup status
These aren't separate concerns. They're all "is my project healthy?"
The SlyDuck Approach
One dashboard. One health score. All your projects.
- Uptime checked every 5 minutes
- Dependencies scanned daily
- SSL expiry tracked automatically
- Performance via PageSpeed Insights
- SEO essentials monitored
When something needs attention, it shows up in one place.
The Math
| Tool | Free Tier | Paid |
|------|-----------|------|
| UptimeRobot | 50 monitors | $7+/mo |
| Snyk | Limited scans | $25+/mo |
| PageSpeed | Manual only | N/A |
| StatusCake | Basic | $20+/mo |
| SlyDuck | 1 project | $5/project |
More importantly: One place to check. One set of alerts. One mental model.
Try the Consolidated Life
Add your projects. Stop the morning dashboard tour.
---
First project free, always. Simplify your morning.
One dashboard. All your projects.
Stop the morning tab marathon. SlyDuck consolidates uptime, dependencies, performance, and SEO into a single view across every project you run.
Consolidate Your MonitoringJames Wolf
Founder @ SlyDuck
Building SlyDuck: the growth dashboard for vibe coders. Builder, leader, Dad, creator.
Related Articles
The 5-Minute Project Health Check
You just connected a project to SlyDuck. In five minutes, you'll know more about its health than you did in the last six months. Here's what happens.
Your Clients Don't Care About Uptime (Until It's Down)
For freelancers and agencies: how to proactively report project health to clients before they notice problems. Turn monitoring into a selling point.